Enable Multiple Diagnostic Settings on Azure Resources With Arm Templates

In this post I will show you how to configure diagnostic settings on Azure resources using an Azure Resource Manager (ARM) template. With the diagnostic settings enabled, you can store the diagnostics in blob storage or use it other services, such as Log Analytics.
Resource diagnostic logs and diagnostic settings
Many resources in Microsoft Azure emit diagnostic logs. These logs contain operational data about the resource. Depending on the type of resource, the logs contain information about audits, counters, errors, performance metrics, etc. The diagnostic logs can be stored or used by several other services in Azure, namely Storage Accounts, Event Hubs and OMS Log Analytics. This is configured in something that's called a diagnostic 'setting'.
Last year Microsoft added the capability to configure multiple resource diagnostic settings on a single resource. This allows us to send the diagnostic data to multiple outputs simultaneously. This could be very usefull in cases where you would like to share the diagnostic data with multiple teams, who each have their own Log Analytics workspace, for example.
Diagnostic settings in the Azure portal
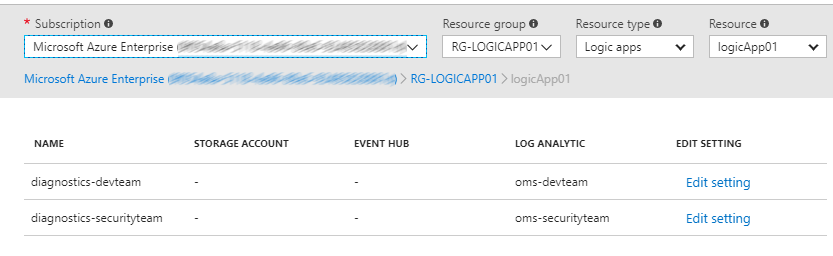
The diagnostic settings of an Azure resource can be found by opening a resource in the Azure portal. In the menu on the left, under Monitoring, you'll see Diagnostic logs. Below you can see I configured two Diagnostic settings which send diagnostic logs to two different OMS Log Analytics workspaces.
Diagnostic settings in Azure
Configuring multiple diagnostic settings programmatically
The process of configuring multiple diagnostic settings on a particular Azure resource is pretty intuitive in the Azure portal. But what if you want to do this programmatically? At the moment of writing (Februari 2018), configuring multiple diagnostic settings cannot be done with the AzureRM Powershell module. The only way to accomplish this to use an Azure Resouce Manager template.
The trick is to include a child resource of the following type:
"type": "providers/diagnosticSettings"
The following code snippet is from a template that deploys a Logic App with two diagnostic settings. Notice the description of the Logic App and the child resources that it contains for the diagnostic settings.
 1  "resources": [
 2    {
 3      "type": "Microsoft.Logic/workflows",
 4      "name": "[parameters('logicAppName')]",
 5      "apiVersion": "2016-10-01",
 6      "location": "[resourceGroup().location]",
 7      "properties": {
 8        "definition": "[parameters('logicAppDefinition')]",
 9        "parameters": {},
10        "state": "Enabled"
11      },
12      "resources": [
13        {
14          "type": "providers/diagnosticSettings",
15          "name": "[concat('Microsoft.Insights/', parameters('diagnosticSettingName01'))]",
16          "apiVersion": "2017-05-01-preview",
17          "properties": {
18            "name": "[parameters('diagnosticSettingName01')]",
19            "storageAccountId": null,
20            "eventHubAuthorizationRuleId": null,
21            "eventHubName": null,
22            "workspaceId": "[parameters('workspaceId01')]",
23            "logs": [
24              {
25                "category": "WorkflowRuntime",
26                "enabled": true,
27                "retentionPolicy": {
28                  "days": 0,
29                  "enabled": false
30                }
31              }
32            ],
33            "metrics": [
34              {
35                "timeGrain": "PT1M",
36                "enabled": true,
37                "retentionPolicy": {
38                  "enabled": false,
39                  "days": 0
40                }
41              }
42            ]
43          },
44          "dependsOn": [
45            "[resourceId('Microsoft.Logic/workflows', parameters('logicAppName'))]"
46          ]
47        },
48        {
49          "type": "providers/diagnosticSettings",
50          "name": "[concat('Microsoft.Insights/', parameters('diagnosticSettingName02'))]",
51          "apiVersion": "2017-05-01-preview",
52          "properties": {
53            "name": "[parameters('diagnosticSettingName02')]",
54            "storageAccountId": null,
55            "eventHubAuthorizationRuleId": null,
56            "eventHubName": null,
57            "workspaceId": "[parameters('workspaceId02')]",
58            "logs": [
59              {
60                "category": "WorkflowRuntime",
61                "enabled": true,
62                "retentionPolicy": {
63                  "days": 0,
64                  "enabled": false
65                }
66              }
67            ],
68            "metrics": [
69              {
70                "timeGrain": "PT1M",
71                "enabled": true,
72                "retentionPolicy": {
73                  "enabled": false,
74                  "days": 0
75                }
76              }
77            ]
78          },
79          "dependsOn": [
80            "[resourceId('Microsoft.Logic/workflows', parameters('logicAppName'))]"
81          ]
82        }
83      ]
84    }
85  ]
The diagnostic settings are configured so that they send the Logic App "WorkflowRuntime" logs and performance metrics to two separate OMS Log Analytics workspaces. For the full template, go here to the gist on Github.
How to know which logs and metrics are available?
Because each service in Azure is different, they generate different types of logs and metrics. So how do you know which logs and metrics are available for use in diagnostic settings?
The easiest way I found is to first configure the diagnostic settings on a resource using the Azure portal. The Azure portal will display the available logs and metrics that are available. In case of a Logic App this looks like this:
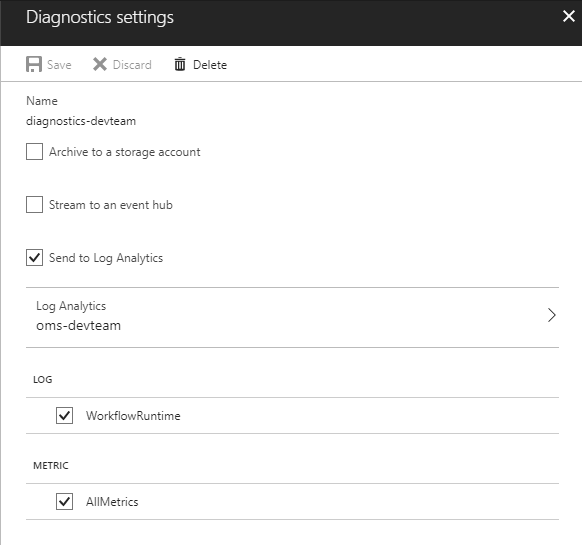
Diagnostics settings blade in Azure portal
Then go to the Resource Group, and in the left menu, under Settings click on Automation Script. This generates an ARM template for the resources in your Resource Group, including the diagnostic settings that you configured on your resource(s).
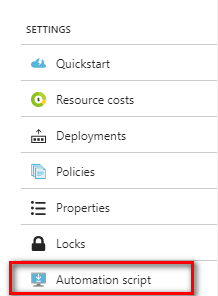
Automation script option in the Azure portal
To conclude
Although Powershell support for diagnostic settings is lacking, using ARM templates is a pretty good alternative. Perhaps it's even your preferred method of deploying and configuration of your resources in Azure.